Jul 23rd 2018
Since its debut in July, the increasingly popular Fortnite “Battle Royale” game has become a gaming marvel, pulling in over 125 million online players in its first year alone. To understand player purchase behaviors in Fortnite compared to its competitor PlayerUnknown’s Battlegrounds (PUBG), Edison Trends analyzed the sales underpinning the two games.
Looking at the traction and trend of revenues for both games, Edison Trends’ found that Fortnite revenues, which had been increasing by an average of 110% per month since November, finally fell in June by 23%. PlayerUnknown's Battlegrounds, however, saw an increase in June of 27%.

Figure 1: Data shows the estimated revenue of Fortnite compared to PlayerUnknown's Battlegrounds between August 2017 - June 2018, based on the Edison Trends dataset.
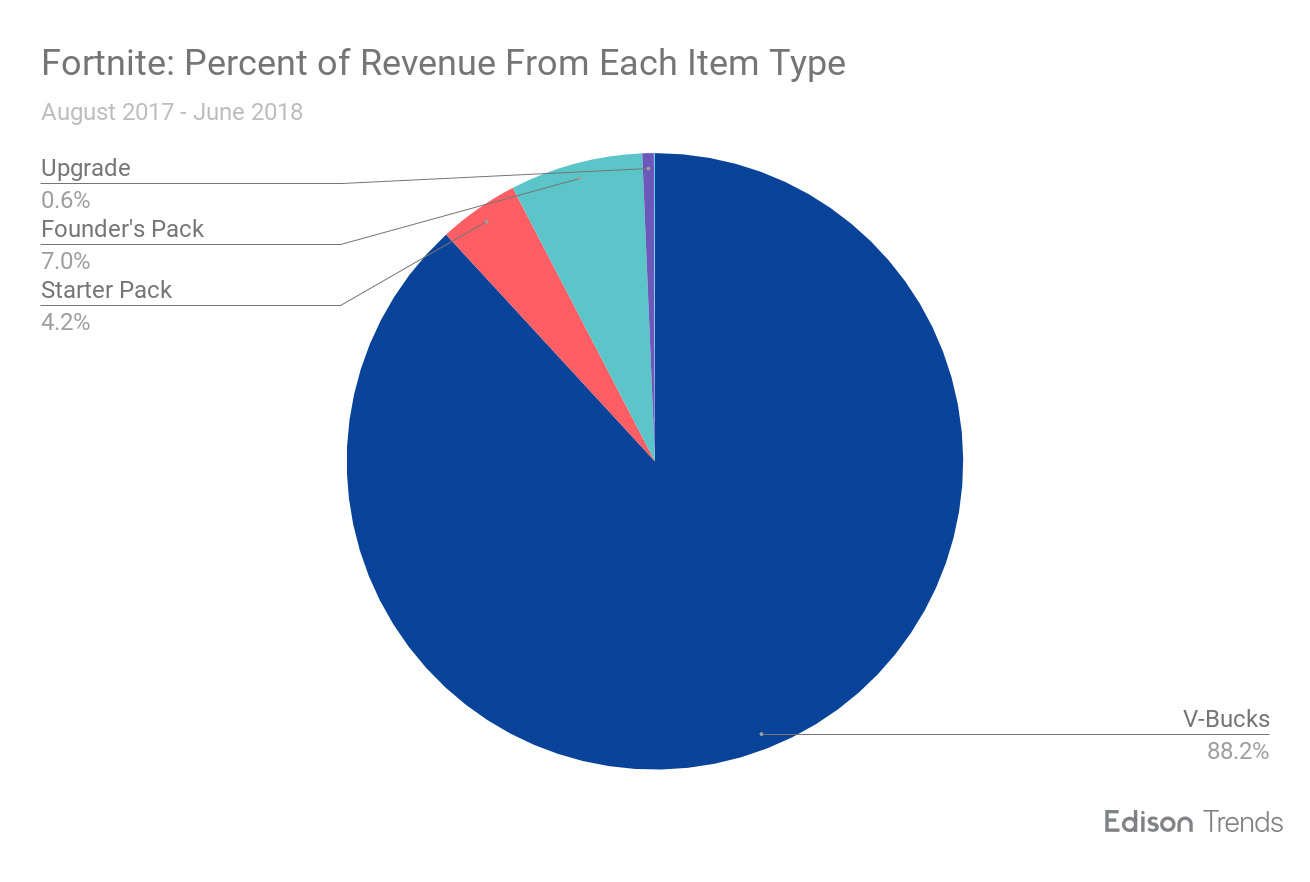
V-Bucks are the most popular in-game purchase for Fortnite players, making up 83% of items purchased and 88% of spending. While different V-Bucks amounts are available for purchase, the single most popular Fortnite item is 1,000 V-Bucks for $9.99, accounting for 53% of items purchased and 33% of spending.
About 67% of items purchased by Fortnite players fall in the $0-$9.99 range. While only 3% of purchases cost $50 or more, together they brought in 15% of Fortnite revenue.


Figure 2a: Data shows the estimated revenue from item type and price range by Fortnite players August 2017 - June 2018, based on the Edison Trends dataset.
77% of PUBG purchases were the game itself, and 23% were in-game items. The most popular in-game purchase is 180 Unknown Cash for $2.99. It makes up 39% of in-game Unknown Cash purchases. However, in-game purchases still account for only a small share of PUBG revenue, at 6%.
75% of PUBG purchases were in the $25-$49.99 range. These purchases accounted for 93% of PUBG revenues.


Figure 2b: Data shows the estimated revenue from item type and price range by PUBG players August 2017 - June 2018, based on the Edison Trends dataset.
Sony took in the largest share of Fortnite revenues at 47%, with Microsoft not far behind at 37%. For PUBG, Microsoft was the largest player at 51%. Apple and Google claimed small slices of the pie at 4% and 1% respectively.


Figure 3: Data shows the estimated revenue volume by platform compared between Fortnite and PUBG games during the period of August 2017 - June 2018, based on the Edison Trends dataset.
Fortnite's average spend per item hovered around $16 across platforms, but PUBG's average costs showed a sharp split between Microsoft Xbox and Steam, who offer the game itself for purchase, and Apple and Google, who offer the free mobile version with in-app purchases.


Figure 3: Data shows the estimated revenue volume by platform compared between Fortnite and PUBG games during the period of August 2017 - June 2018, based on the Edison Trends dataset.
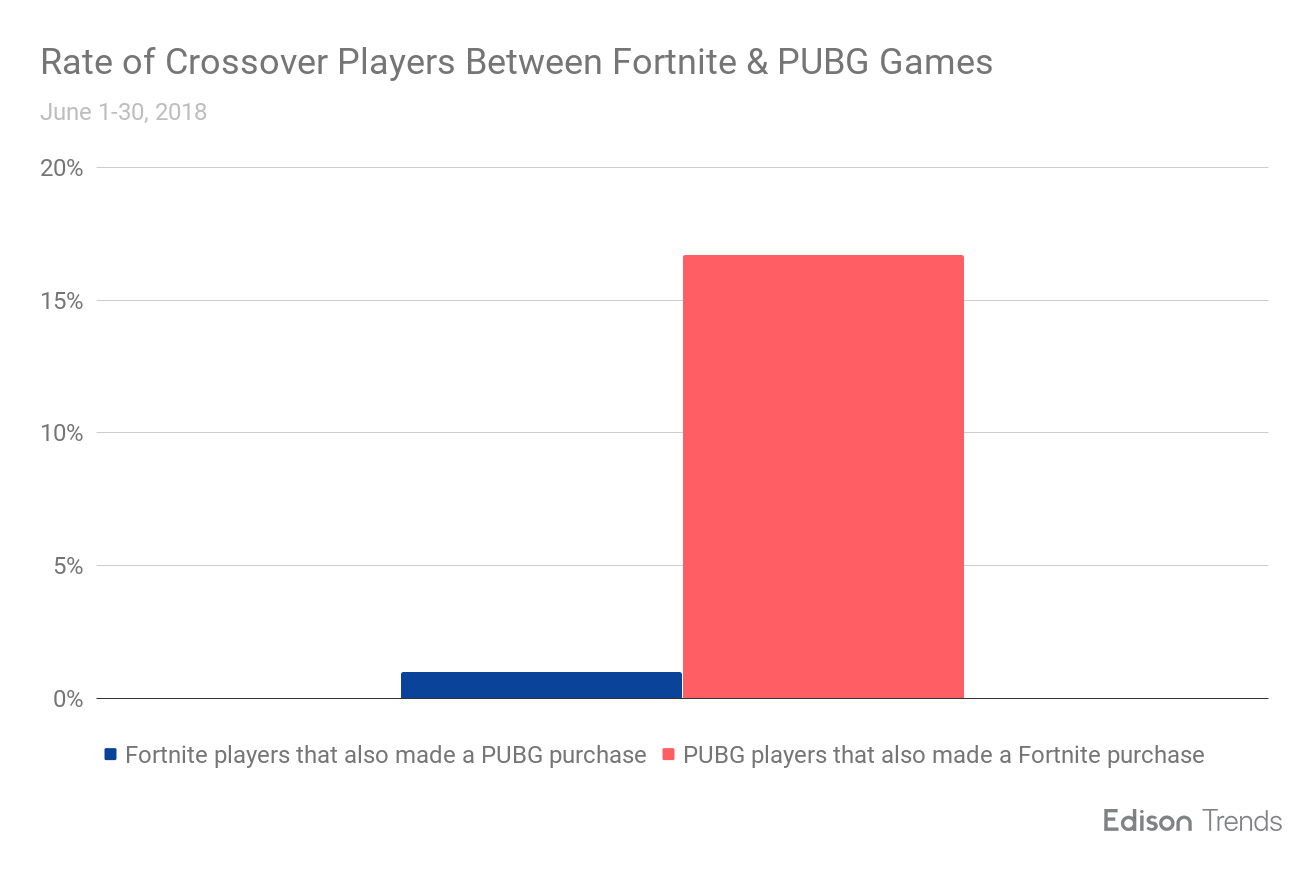
In June, 17% of players who made a PUBG purchase also made a Fortnite purchase, but only 1% of players making a Fortnite purchase also spent on PUBG.

Figures on graphs have been normalized. A conversion factor has been applied so that the highest sales day for each graph is given the value of 100, and all other days are adjusted by that factor, maintaining the same relationship to each other as before. e.g. 20% in a chart means ‘20% of the sales of the peak period’ (100%).
As the market evolves, we will continue to stay on top of the latest trends. To learn more about how Edison Trends can help your business, contact us at bizdev@edison.tech. For more up-to-date insights in the e-commerce space, be sure to subscribe to our newsletter, and follow us on Twitter at @EdisonTrends.
*The data shown is based on a sample of anonymized and aggregated e-receipts from millions of consumers in the United States.