


YOUR NEW SOURCE OF TRUTH
Have Confidence in Actionable Data
We answer key questions on companies to help investors make smarter decisions and help companies to increase share, sales, and customers
90+
Reports2M
E-Receipt Panelists20K
BrandsUnmatched Accuracy
10 years of experience combined with large sample sizes create scale for unmatched accuracy
Near Real-Time data delivery
Alternative data delivered as fast as possible
Transparent methodologies and sample sizes
90+
Reports2M
E-Receipt Panelists20K
BrandsScore card of accuracy and sample size available
YOUR SINGLE SOURCE OF TRUTH
The YipitData Difference
We identify, collect, clean, and analyze the best data in the world to deliver accurate answers to your questions, so you can focus on decisions
![]() indicates proprietary data source or proprietary methodology
indicates proprietary data source or proprietary methodology
RECEIPT DATA
Item and category level data for retailers and brands
CARD DATA
Full order level retailer coverage supported by robust sample
WEB DATA
Cutting-edge web data collected from numerous sites across industries
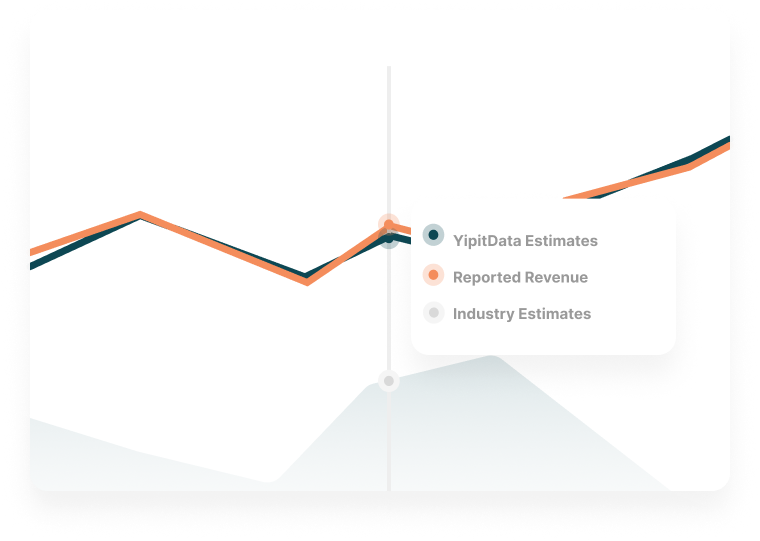
PUBLIC EARNINGS
Results calibrated to company-reported earnings through transparent self-audits
40+ Datasets
Ongoing acquisition of diverse datasets for maximum client value


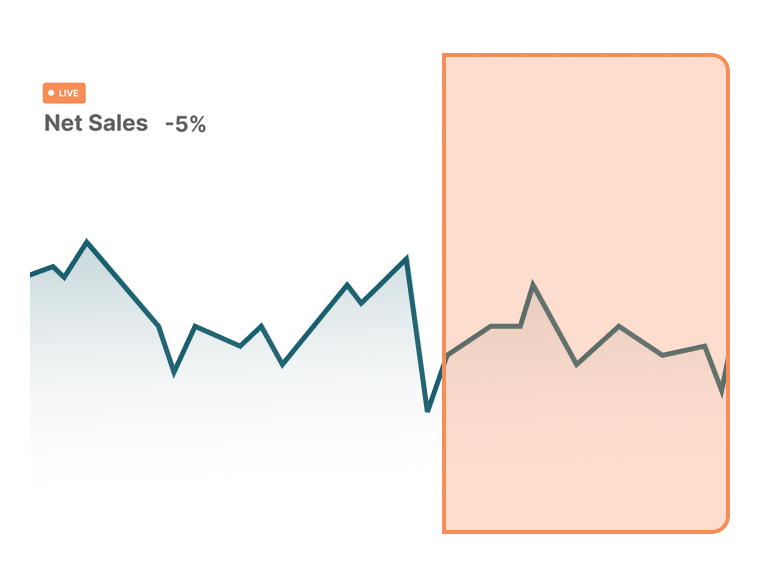
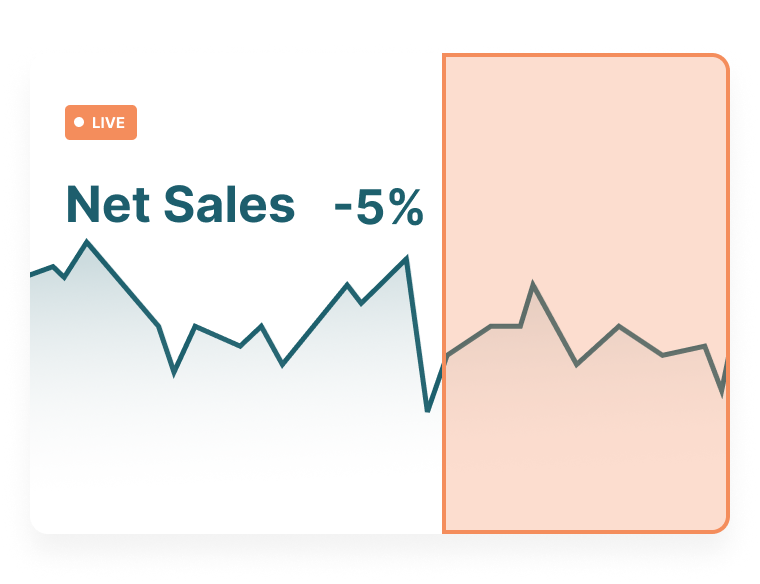
Accurate Data You Can Trust
In Depth Views on Business Performance
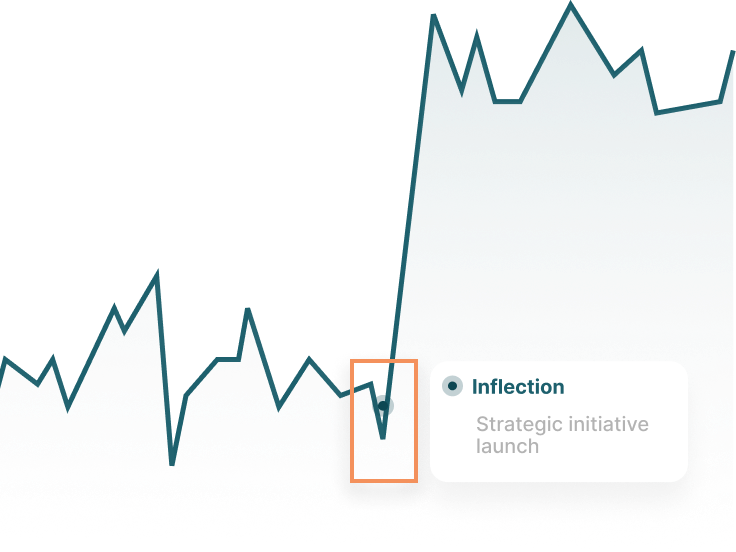
Actionable data on the companies that matter to you
Gain transparency into the building blocks of company performance with access to accurate timely data in the format that best suits your process.
See Our Coverage
Research & Analysis
Get detailed analysis from top-line to in-depth business performance.

Dashboards
View KPIs and granular datasets through our platform of dashboards.

Data Feeds
Gain access to the underlying data feeds that power YipitData.

StyleWell Backless Saddle Seat Fabric Upholstered Bar Stool in Riverbed Beige
$189.00

Modern Threads Trefoil 6-Piece Gold Geometric Bath Towel Set
$80.00

NINJA Professional Blender, 72 oz. 3 Speed 1000-Watt Black Blender (BL610)
$99.99
Paid with Visa CC

Item(s) discount
-$63.28Subtotal
$305.74Shipping
FREESales Tax
$22.93Order Total
$328.67Fuel revenue growth with data driven decisions
Accurate market measurement with the ability
to diagnose the consumer behaviors that
drive performance.

Market Trends
Market share breakdowns by in-store & online, sub-category, region, or demographic.

Consumer Behavior
Consumer behavior diagnostics including cross-shopping & leakage, customer acquisition & frequency, and AOV.

Product Category Analysis
Category & sub-category analysis for custom categorizations, competitive pricing, discounting, and assortment analysis.
Largest & Most Trusted Data Partner
We provide funds and companies with the data they need to make decisions
2000+
Companies Covered
500+
Customers

Carlyle Group Leads 475M Series E
YipitData announced a Series E funding round, led by global investment firm Carlyle (NASDAQ: CG). YipitData has gained rapid momentum among institutional investors and corporations with its highly accurate, detailed research